 Gary Bredeson
The market potential for existing-home sales in April declined 3 percent compared with last month, falling to 5.74 million at a seasonally adjusted annualized rate (SAAR). Housing market potential is down 8.1 percent, compared with the roaring housing market in April 2021, but today’s housing market is still very 2019, which was the housing market’s strongest year in a decade at the time. In fact, the market potential for existing-home sales remains 4.2 percent higher than April 2019.
“The frenzy of the pandemic-era housing market appears to be the historical exception, not the rule. The housing market is adjusting to a not-so-new normal.”
Mortgage rates increased significantly in April. The jump in mortgage rates came as the Federal Reserve signaled it would soon tighten monetary policy to intensify its fight against inflation.
What’s the Fed Got to do with It?
The Federal Reserve is actively trying to tame inflation and recently announced a 50-basis point increase in the federal funds rate. The Fed will also begin quantitative tightening in June, announcing it will let $30 billion of Treasury bonds and $17.5 billion of mortgage-backed securities mature each month through August. How inflation and the broader economy respond to the Fed’s monetary policy tightening will influence further Fed action. If inflation doesn’t decline as expected, the Fed may feel the need to more aggressively increase the federal funds rate and the pace of quantitative tightening, which may put further upward pressure on mortgage rates.
The Dual Impact of Rising Mortgage Rates
Rising mortgage rates impact housing market potential in two ways -- reducing affordability and increasing the number of homeowners’ that are rate locked-in. While these forces may reduce existing-home sales, they will also bring much-needed balance to the housing market.
Higher rates reduce affordability: In April 2022, the average 30-year, fixed mortgage rate was 4.98 percent, which is almost two percentage points higher than one year ago. Holding household income constant at its April 2021 level, the increase in the average mortgage rate since last April reduced house-buying power by nearly $96,000. However, household income increased by 5 percent year over year, which helped ease the loss in house-buying to $77,000. The year-over-year decline in house-buying power reduced housing market potential by nearly 380,000 potential home sales. Even though that is a significant decline in the potential number of home sales, it is relative to an unusually high level of potential sales in April 2021, which were fueled by pandemic-driven demand and historically low mortgage rates. Comparing today’s potential home sales levels to April 2019, before the pandemic, provides some helpful perspective. In fact, the market potential for existing-home sales is approximately 230,000 above the pre-pandemic benchmark of April 2019.
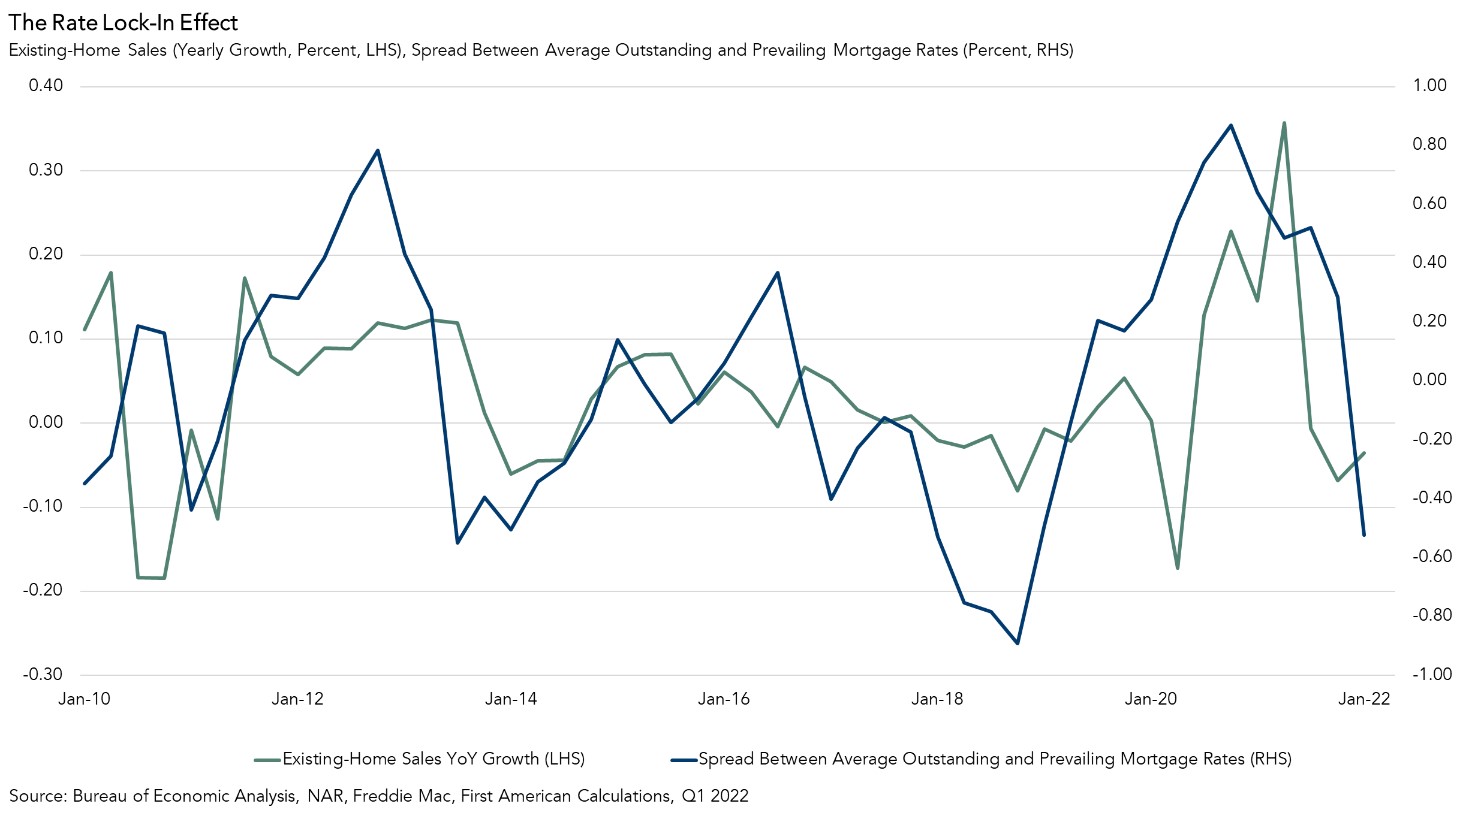
Higher rates keep homeowners rate-locked in: Existing homeowners are rate locked-in when their existing mortgage rates are below the prevailing market mortgage rate, creating a financial disincentive to sell their homes and buy new homes at a higher mortgage rate. The strength of this rate lock-in effect can be estimated using the difference between the average rate for all outstanding mortgages and the prevailing market mortgage rate. As the prevailing market mortgage rate rises further and further above the average rate for all outstanding mortgages, the greater number of existing homeowners are rate-locked in. In April, homeowners staying put resulted in a loss of nearly 81,000 potential home sales.
A Return to Not-So-New Normal
The frenzy of the pandemic-era housing market appears to be the historical exception, not the rule. Recency bias may have many believing that mortgage rates below 4 percent is normal, but it is anything but normal from a historical perspective. In fact, the historical average for the 30-year, fixed mortgage rate is nearly 8 percent. The rate lock-in effect will constrain supply below demand, making real house price declines unlikely. The good news for potential home buyers is that rising mortgage rates may help to cool the rapid pace of house price appreciation as some potential buyers will pull back from the market. As higher mortgage rates slow the housing market from its 150-mile-per-hour pace to something more in the line with its historical speed limit, sellers’ market conditions should ease and home buyers will benefit from a not-so-new normal.
April 2022 Potential Home Sales
For the month of April, First American updated its proprietary Potential Home Sales Model to show that:
- Potential existing-home sales decreased to a 5.74 million seasonally adjusted annualized rate (SAAR), a 3.0 percent month-over-month decrease.
- This represents a 64.6 percent increase from the market potential low point reached in February 1993.
- The market potential for existing-home sales decreased 8.1 percent compared with a year ago, a loss of 503,350 (SAAR) sales.
- Currently, potential existing-home sales is 1,053,000 (SAAR), or 15.5 percent below the pre-recession peak of market potential, which occurred in April 2006.
First American Deputy Chief Economist Odeta Kushi contributed to this post.
What Insight Does the Potential Home Sales Model Reveal?
When considering the right time to buy or sell a home, an important factor in the decision should be the market’s overall health, which is largely a function of supply and demand. Knowing how close the market is to a healthy level of activity can help consumers determine if it is a good time to buy or sell, and what might happen to the market in the future. That is difficult to assess when looking at the number of homes sold at a particular point in time without understanding the health of the market at that time. Historical context is critically important. Our potential home sales model measures what we believe a healthy market level of home sales should be based on the economic, demographic and housing market environments.
About the Potential Home Sales Model
Potential home sales measures existing-home sales, which include single-family homes, townhomes, condominiums and co-ops on a seasonally adjusted annualized rate based on the historical relationship between existing-home sales and U.S. population demographic data, homeowner tenure, house-buying power in the U.S. economy, price trends in the U.S. housing market, and conditions in the financial market. When the actual level of existing-home sales are significantly above potential home sales, the pace of turnover is not supported by market fundamentals and there is an increased likelihood of a market correction. Conversely, seasonally adjusted, annualized rates of actual existing-home sales below the level of potential existing-home sales indicate market turnover is underperforming the rate fundamentally supported by the current conditions. Actual seasonally adjusted annualized existing-home sales may exceed or fall short of the potential rate of sales for a variety of reasons, including non-traditional market conditions, policy constraints and market participant behavior. Recent potential home sale estimates are subject to revision to reflect the most up-to-date information available on the economy, housing market and financial conditions. The Potential Home Sales model is published prior to the National Association of Realtors’ Existing-Home Sales report each month.
Follow Hashtags: #Listings #Buyers #Investors #InvestmentProperties #RealtorGaryBredeson #MoveUpBuyers #DownSizingBuyers #FirstTimeBuyers #DivorceSellers #TwinCities #TwinCitiesMN #NationalAssociationOfRealtors


