 Elmer G. Martinez
In February 2022, the Real House Price Index (RHPI) jumped up by nearly 31 percent. That’s the fastest growth in the more than 30-year history of the series. This rapid annual decline in affordability was driven by two factors: a 21.7 percent annual increase in nominal house prices and a nearly full percentage point increase in the 30-year, fixed mortgage rate compared with one year ago. Rising mortgage rates impact both housing supply and demand, limiting supply by reducing the propensity of homeowners to sell and flattening demand by reducing consumer house-buying power.
“The last two years were the exception, not the rule, and the housing market is adjusting to a not-so-new normal.”
For home buyers, the only way to mitigate the loss of affordability caused by a higher mortgage rate is with an equivalent, if not greater, increase in household income. Even though household income has increased 5.1 percent since February 2021 and boosted consumer house-buying power, it was not enough to offset the affordability loss from higher rates and rapidly rising nominal prices.
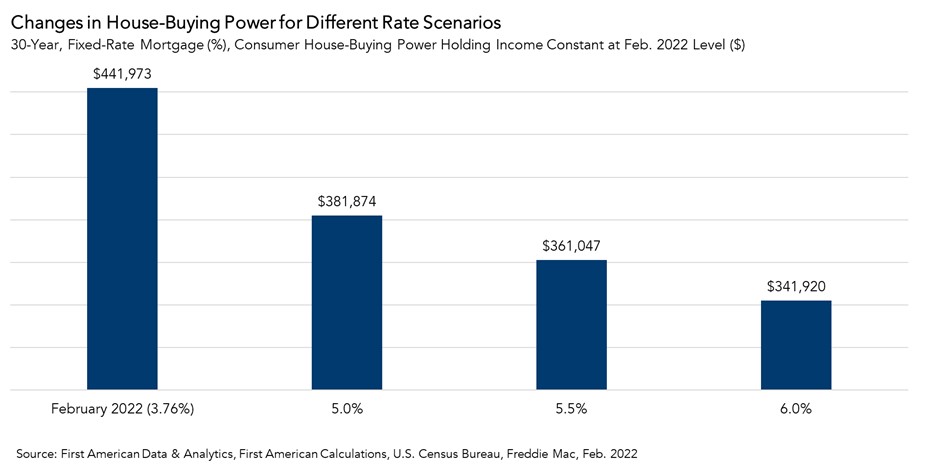
Rising mortgage rates and surging nominal house prices are expected to continue outpacing household income, so affordability will likely wane further nationally in the near term. One forecast, based on an estimate of when the 10-year Treasury yield will peak, suggests that the 30-year, fixed mortgage rate will likely peak between 5.0 and 5.7 percent, but may move as high as the low 6 percent range. So, let’s examine how these mortgage rate scenarios would impact house-buying power.
Rates Above 5.5 Percent Likely in 2022
We can use the RHPI to model shifts in income and interest rates and see how they either increase or decrease consumer house-buying power and affordability. When incomes rise and/or mortgage rates fall, consumer house-buying power increases.
In the latest RHPI report reflecting February 2022 data, the 30-year, fixed mortgage rate stood at 3.8 percent. Since then, rates have increased sharply, breaking the 5-percent barrier in mid-April. The increase in rates since February reduced house-buying power by $60,000. If the average mortgage rate reached 5.5 percent, assuming a 5 percent down payment and average household income of approximately $70,800, house-buying power falls by an additional $21,000. If rates increased even higher to 6.0 percent, house-buying power would fall by $40,000 compared with 5.0 percent.
Context is Key
Rising mortgage rates impact affordability, but historical context is important. An average 30-year, fixed mortgage rate of 5.5 percent is still well below the historical average of nearly 8 percent. Even with mortgage rates at 5.5 percent, house-buying power is over $360,000, which is still strong and at the same level as 2018. Recency bias may have many thinking that rates below 3 percent and house-buying power above $450,000 is normal, but it is anything but normal from a historical perspective. The last two years were the exception, not the rule, and the housing market is adjusting to a not-so-new normal.
For more analysis of affordability, please visit the Real House Price Index. The RHPI is updated monthly with new data. Look for the next edition of the RHPI the week of May 30, 2022.
Sources:
February 2022 Real House Price Index Highlights
The First American Real House Price Index (RHPI) showed that in February 2022:
- Real house prices increased 5.8 percent between January 2022 and February 2022.
- Real house prices increased 30.6 percent between February 2021 and February 2022.
- Consumer house-buying power, how much one can buy based on changes in income and interest rates, decreased 3.6 percent between January 2022 and February 2022, and decreased 6.8 percent year over year.
- Median household income has increased 5.1 percent since February 2021 and 70.4 percent since January 2000.
- Real house prices are 5.7 percent more expensive than in January 2000.
- While unadjusted house prices are now 48.8 percent above the housing boom peak in 2006, real, house-buying power-adjusted house prices remain 25.8 percent below their 2006 housing boom peak.
February 2022 Real House Price State Highlights
- The five states with the greatest year-over-year increase in the RHPI are: Florida (+43.1), South Carolina (+42.8 percent), Arizona (+39.0 percent), Georgia (+38.8), and Connecticut (+35.8 percent).
- There were no states with a year-over-year decrease in the RHPI.
February 2022 Real House Price Local Market Highlights
- Among the Core Based Statistical Areas (CBSAs) tracked by First American, the five markets with the greatest year-over-year increase in the RHPI are: Charlotte, N.C. (+46.1), Raleigh, N.C. (+42.4 percent), Phoenix (+41.3 percent), Tampa, Fla. (+39.6 percent), and Jacksonville, Fla. (+39.1 percent).
- Among the Core Based Statistical Areas (CBSAs) tracked by First American, there were no markets with a year-over-year decrease in the RHPI.
About the First American Real House Price Index
The traditional perspective on house prices is fixated on the actual prices and the changes in those prices, which overlooks what matters to potential buyers - their purchasing power, or how much they can afford to buy. First American’s proprietary Real House Price Index (RHPI) adjusts prices for purchasing power by considering how income levels and interest rates influence the amount one can borrow.
The RHPI uses a weighted repeat-sales house price index that measures the price movements of single-family residential properties by time and across geographies, adjusted for the influence of income and interest rate changes on consumer house-buying power. The index is set to equal 100 in January 2000. Changing incomes and interest rates either increase or decrease consumer house-buying power. When incomes rise and mortgage rates fall, consumer house-buying power increases, acting as a deflator of increases in the house price level. For example, if the house price index increases by three percent, but the combination of rising incomes and falling mortgage rates increase consumer buying power over the same period by two percent, then the Real House Price index only increases by 1 percent. The Real House Price Index reflects changes in house prices, but also accounts for changes in consumer house-buying power.
Disclaimer
Opinions, estimates, forecasts and other views contained in this page are those of First American’s Chief Economist, do not necessarily represent the views of First American or its management, should not be construed as indicating First American’s business prospects or expected results, and are subject to change without notice. Although the First American Economics team attempts to provide reliable, useful information, it does not guarantee that the information is accurate, current or suitable for any particular purpose. © 2022 by First American. Information from this page may be used with proper attribution.
Follow Hashtags: #DRE01091418 #realtorlife